
- 0
- Edited

Introduction
In the evolving world of observability and cloud infrastructure, the OpenTelemetry Collector has emerged as a vital tool. As a central component in the OpenTelemetry ecosystem, the Collector plays a crucial role in managing data from various sources. This guide explores the OpenTelemetry Collector, its functionalities, and how to effectively utilize it for metrics, logs, and data processing.
Understanding the OpenTelemetry Collector
The OpenTelemetry Collector is designed to receive, process, and export telemetry data, including logs, metrics, and traces. While it is a fundamental element in the OpenTelemetry architecture, it operates independently of the W3C Trace Context. This flexibility allows it to be used in various scenarios, including integrating with monitoring solutions like Prometheus and visualization tools like Grafana.
Key Features of the OpenTelemetry Collector
Data Types: The Collector handles three primary data types:
- Logs: System and application logs.
- Metrics: Performance data and usage statistics.
- Traces: Distributed traces that track requests through a system.
Push and Pull Models: It supports both push and pull models for data collection:
- Push Model: Data is sent from the source to the Collector.
- Pull Model: The Collector fetches data from the source.
Operations: The Collector performs several operations, including:
- Reads: Collecting data from various sources.
- Transforms: Modifying data to fit desired formats or standards.
- Writes: Exporting processed data to various destinations.
Getting Started with OpenTelemetry Collector
Setting Up Your Environment
To begin, you’ll need to set up an environment with Docker Compose to run the OpenTelemetry Collector. Here’s a simple configuration for scraping metrics from a Prometheus-compatible endpoint:
yaml
version: "3"
services:
fake-metrics:
build: ./fake-metrics-generator
collector:
image: otel/opentelemetry-collector:0.87.0
environment:
- METRICS_HOST=fake-metrics
- METRICS_PORT=5000
volumes:
- ./config/collector/config.yml:/etc/otelcol/config.yaml:roConfiguring the Collector
Create a configuration file (config.yml) to define how the Collector handles data.
Basic Configuration
Copy code
receivers:
prometheus:
config:
scrape_configs:
- job_name: fake-metrics
scrape_interval: 3s
static_configs:
- targets: [ "${env.METRICS_HOST}:${env.METRICS_PORT}" ]
exporters:
logging:
loglevel: debug
service:
pipelines:
metrics:
receivers: [ "prometheus" ]
exporters: [ "logging" ]Advanced Configuration
Exposing Metrics to Prometheus
To expose metrics to Prometheus and visualize them in Grafana, update your configuration:
Copy code
exporters:
prometheus:
endpoint: ":${env:PROMETHEUS_PORT}"
logging:
loglevel: debug
service:
pipelines:
metrics:
receivers: [ "prometheus" ]
exporters: [ "prometheus", "logging" ]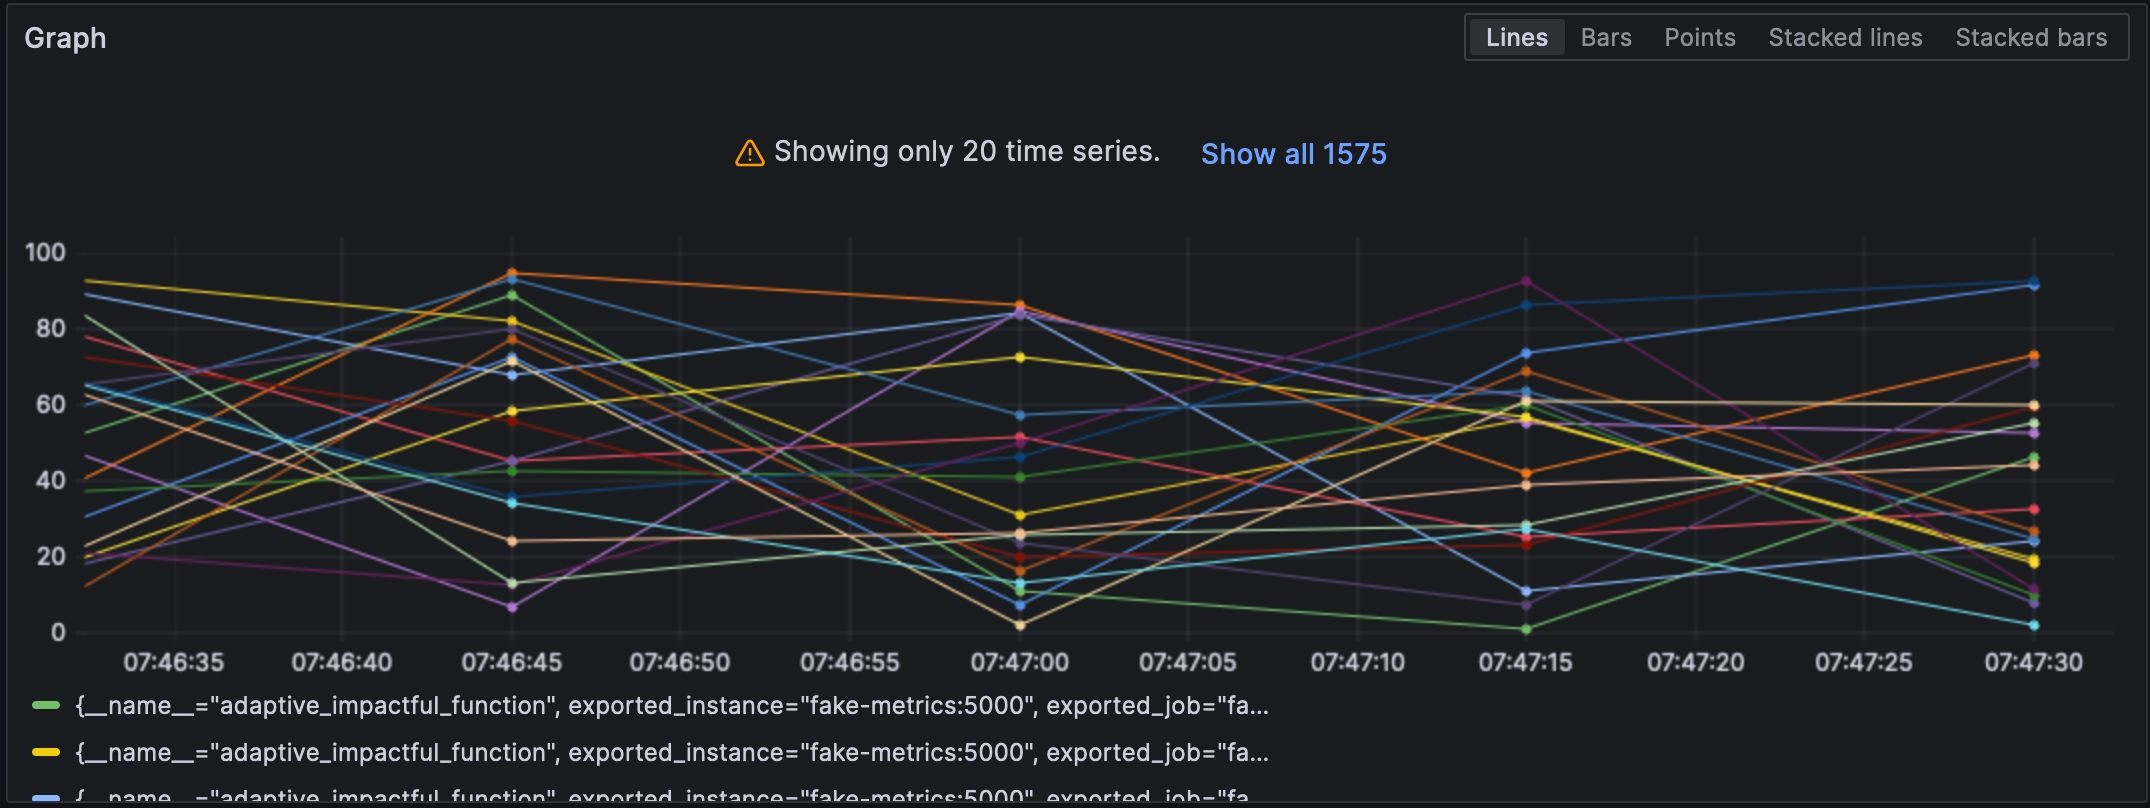
Data Processing with Processors
The Collector can transform data to meet specific requirements. For instance, to add labels or rename metrics:
Copy code
processors:
metricstransform:
transforms:
- include: ^fake_(.*)$
match_type: regexp
action: update
operations:
- action: add_label
new_label: origin
new_value: fake
- action: update
new_name: $${1}
service:
pipelines:
metrics:
receivers: [ "prometheus" ]
processors: [ "metricstransform" ]
exporters: [ "prometheus" ]Connecting Receivers and Exporters
You can also use connectors to link receivers and exporters, such as connecting a log receiver to a metrics exporter:
Copy code
receivers:
filelog:
include: [ "/var/logs/generated.log" ]
connectors:
count:
requests.errors:
description: Number of 500 errors
condition: [ "status == 500 " ]
service:
pipelines:
logs:
receivers: [ "filelog" ]
exporters: [ "count" ]
metrics:
receivers: [ "prometheus", "count" ]Manipulating Logs
To manipulate log data, such as changing timestamps or removing fields, use log processors:
Copy code
receivers:
filelog:
include: [ "/var/logs/generated.log" ]
operators:
- type: json_parser
timestamp:
parse_from: attributes.datetime
layout: "%d/%b/%Y:%H:%M:%S %z"
severity:
parse_from: attributes.status
mapping:
error: 5xx
warn: 4xx
info: 3xx
debug: 2xx
- id: remove_body
type: remove
field: body
- id: remove_datetime
type: remove
field: attributes.datetime
- id: remove_status
type: remove
field: attributes.status
exporters:
loki:
endpoint: "http://loki:3100/loki/api/v1/push"
service:
pipelines:
logs:
receivers: [ "filelog" ]
exporters: [ "loki" ]Conclusion
The OpenTelemetry Collector is a powerful tool for managing telemetry data across different systems. Whether you are collecting metrics, logs, or traces, the Collector’s flexibility and configurability make it an essential component in any observability strategy. For further exploration, refer to the OpenTelemetry Collector documentation.
For the complete source code and additional resources, visit our GitHub repository.