📚 7-Day Observability Tutorial Series
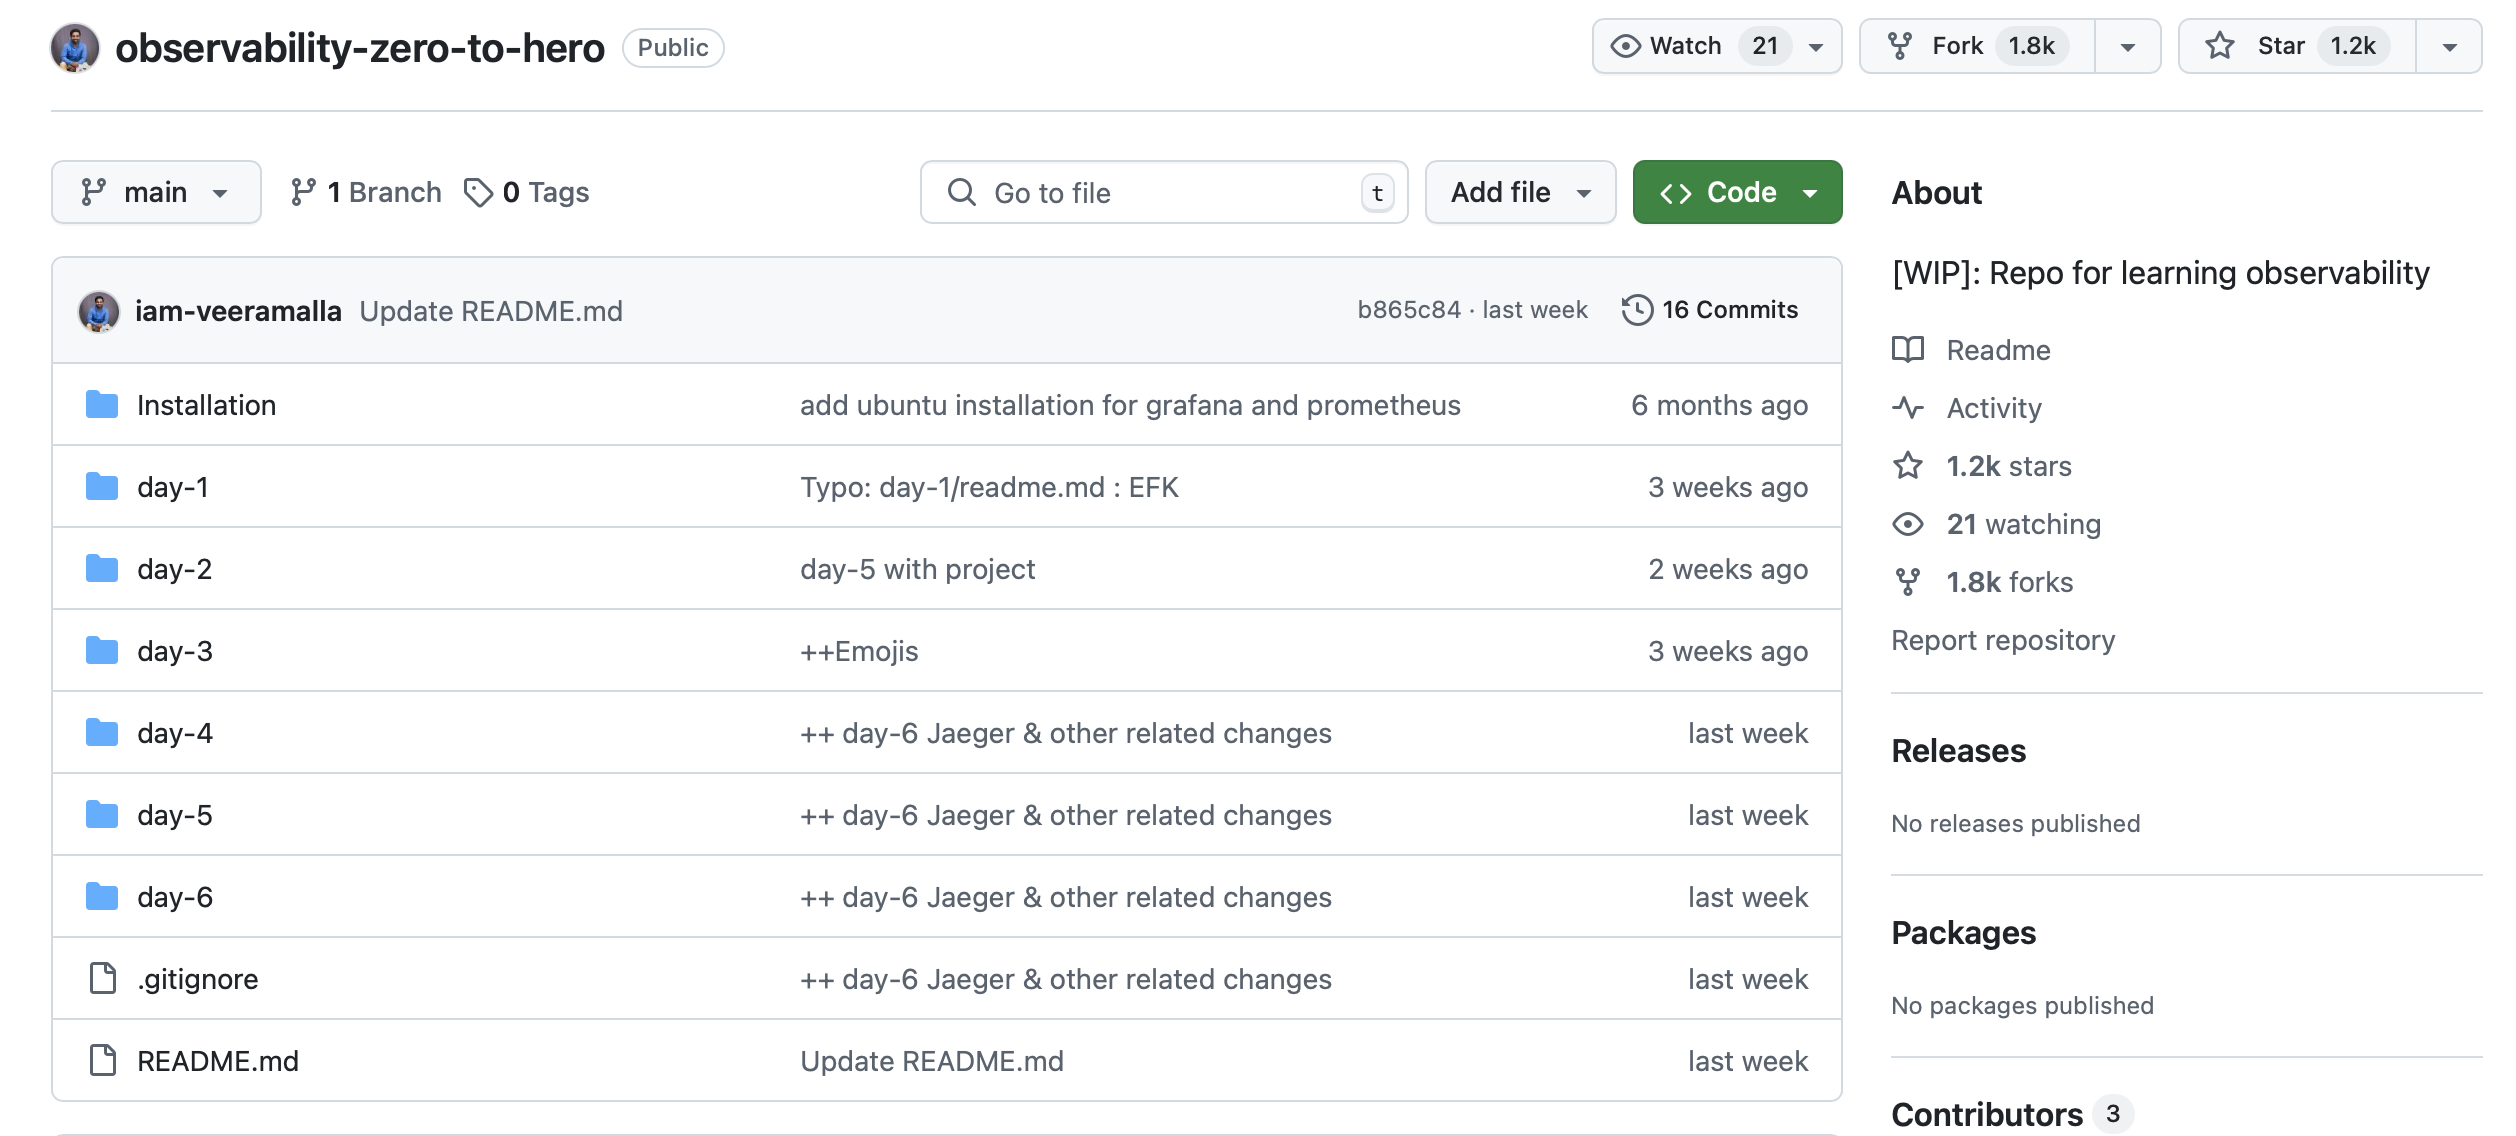
Github: iam-veeramalla/observability-zero-to-hero
Welcome to the 7-Day Observability Tutorial Series! This repository contains the code and detailed explanations for setting up and understanding observability in Kubernetes using Prometheus, Grafana, Elasticsearch, Fluentbit, and Kibana.

📅 Overview of Each Day
Day 1: Introduction to Observability
Concepts Covered:
- Introduction to Observability, Monitoring, Logging, and Tracing.
- The difference between Monitoring and Observability.
- Tools available for Monitoring and Observability.
- Comparison between monitoring and observing in Bare-Metal Servers vs. Kubernetes.
Key Learning:
- Understand the fundamental concepts of observability.
- Learn why monitoring and observability are crucial in modern IT environments.
Day 2: Prometheus - Setting Up Monitoring
Concepts Covered:
- Introduction to Prometheus and its architecture.
- Setup and configuration of Prometheus in an EKS cluster.
- Installation of
kube-prometheus-stack with Helm and integrating it with Grafana.
- Basic queries and setup for monitoring with Prometheus and Grafana.
Key Learning:
- Get hands-on experience with Prometheus and Grafana.
- Learn to install and configure Prometheus on Kubernetes.
Day 3: Metrics and PromQL in Prometheus
Concepts Covered:
- Understanding different types of metrics in Prometheus: Counter, Gauge, Histogram, and Summary.
- Introduction to PromQL and basic querying techniques.
- Aggregation and functions in PromQL to analyze metrics data.
Key Learning:
- Master the Prometheus Query Language (PromQL) for querying and analyzing metrics.
- Understand how to work with different types of metrics in Prometheus.
Day 4: Instrumentation and Custom Metrics
Concepts Covered:
- Instrumentation for adding monitoring capabilities to applications.
- Writing custom metrics in a Node.js application using the prom-client library.
- Dockerizing the application and deploying it on Kubernetes.
- Setting up Alertmanager for alerting based on custom metrics.
Key Learning:
- Learn how to instrument applications to expose custom metrics.
- Configure alerts in Alertmanager to monitor application performance.
Day 5: Logging with EFK Stack
Concepts Covered:
- Introduction to logging in distributed systems and Kubernetes.
- Setting up the EFK stack (Elasticsearch, Fluentbit, Kibana) on Kubernetes.
- Detailed setup and configuration for collecting and visualizing logs.
- Cleaning up the Kubernetes cluster and resources.
Key Learning:
- Understand the importance of logging and how to set up EFK for log collection and visualization in Kubernetes.
Day 6: Distributed Tracing with Jaeger
Concepts Covered:
- Introduction to Jaeger and its architecture for distributed tracing.
- Setting up Jaeger in a Kubernetes cluster using Helm.
- Instrumenting services using OpenTelemetry to enable tracing.
- Viewing and analyzing traces in the Jaeger UI.
- Cleaning up the environment after setting up Jaeger.
Key Learning:
- Gain insights into distributed tracing and how it helps in debugging and performance optimization.
- Learn how to set up and configure Jaeger for tracing in a microservices architecture.